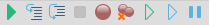
Debug toolbar
Debug toolbar contains buttons intended for code debugging.
|
Toolbar object |
Label |
Description |
|---|---|---|
|
|
Debug |
Execute script php, js, or nodejs file. |
|
|
Step Into |
Click this button to have the debugger step into the method called at the current execution point. |
|
|
Step Over |
Click this button to execute the program until the next line in the current method or file, skipping the methods referenced at the current execution point (if any). If the current line is the last one in the method, execution steps to the line executed right after this method. |
|
|
Stop |
Click this button to terminate the current process externally by means of the standard shutdown script. |
|
|
Add/Remove breakpoint |
Use this button to add or remove the breakpoint at the active line. |
|
|
Clear all breakpoints |
Use this button to Clear all breakpoints in the active file. |
|
|
Debug URL |
Open dialog window for executing a script through the input URL. |
|
|
Debug Project Home URL |
Executing script through input the Project Home URL. You can define it for project debugging in Project properties. |
|
|
Break request |
Break the executable request. |


