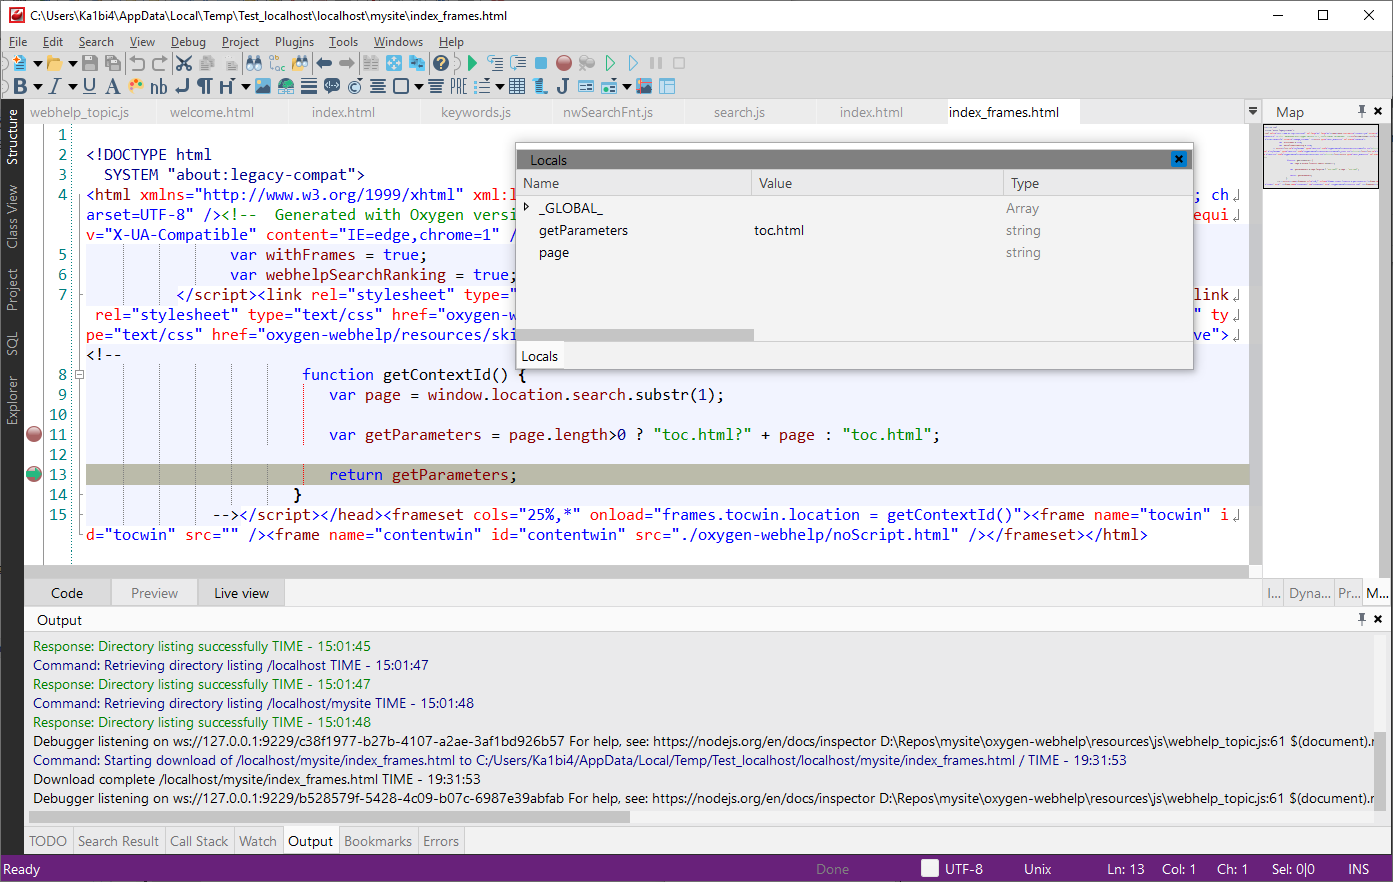
JavaScript Debugging
CodeLobster IDE provides a built-in debugger for your client-side JavaScript code that
works with Chrome. Debugging session is available only during a Live View edit mode for
.js files or <script> tag in .html
files. Before proceeding with any of the debugging scenarios, you need to configure a JavaScript
debugger.
![[Note]](images/admon/note.png) | Note |
|---|---|
Live View works for other file types that contain or generate HTML, PHP, or JavaScript. You can also use Live View when debugging a Node.js application. |
CodeLobster IDE enables the following features for JavaScript debugger:
-
Handling the debugging process using Debug toolbar or hotkeys: Functions Step Into (F11), Step Over (F10), Stop Debug (Shift + F5).
-
Useful debugging tools:
